#35 気圧センサ
Tibbitの配置
Tibbit #35 と Tibbit #00-3を挿入します。
ノードの配置
以下のようにフローを配置します。
ノードの設定を開き、スロットを選択します。
Node-REDデプロイ後、injectノードをクリックすると気圧(kPa)を取得することができます。
サンプルフロー
|
1 |
[{"id":"544fda30.517d24","type":"inject","z":"3c31dc44.0e66fc","name":"","topic":"","payload":"","payloadType":"date","repeat":"","crontab":"","once":false,"onceDelay":0.1,"x":200,"y":400,"wires":[["9435f249.fcabc8"]]},{"id":"52fe40.bb37a9c","type":"debug","z":"3c31dc44.0e66fc","name":"","active":true,"tosidebar":true,"console":false,"tostatus":false,"complete":"false","x":470,"y":480,"wires":[]},{"id":"9435f249.fcabc8","type":"Tibbit-#35","z":"3c31dc44.0e66fc","name":"","tpSlot":"S01","communication":"I2C","connectedStatus":"start","host":"","x":340,"y":440,"wires":[["52fe40.bb37a9c"]]}] |
dashboardで可視化
gauge
簡易的に可視化するために、dashboardのgaugeノードを使用します。
以下のようにフローを配置します。
5秒間隔で表示を更新します。
gaugeノードの設定を開きます。
Units(単位)やRange(範囲)を指定します。
Groupは任意で設定してください。
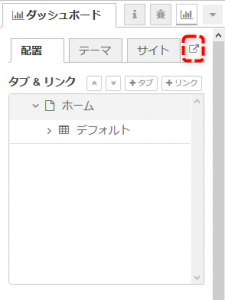
ダッシュボードタブの赤枠をクリックします。
Node-REDデプロイ後、injectノードをクリックするとゲージが5秒間隔で更新されます。
サンプルフロー
|
1 |
[{"id":"544fda30.517d24","type":"inject","z":"3c31dc44.0e66fc","name":"","topic":"","payload":"","payloadType":"date","repeat":"","crontab":"","once":false,"onceDelay":0.1,"x":180,"y":400,"wires":[["9435f249.fcabc8"]]},{"id":"9435f249.fcabc8","type":"Tibbit-#35","z":"3c31dc44.0e66fc","name":"","tpSlot":"S01","communication":"I2C","connectedStatus":"start","host":"","x":340,"y":440,"wires":[["79f67f42.c4eaf8","6614c08f.1d7b38"]]},{"id":"79f67f42.c4eaf8","type":"delay","z":"3c31dc44.0e66fc","name":"","pauseType":"delay","timeout":"5","timeoutUnits":"seconds","rate":"1","nbRateUnits":"1","rateUnits":"second","randomFirst":"1","randomLast":"5","randomUnits":"seconds","drop":false,"x":340,"y":500,"wires":[["9435f249.fcabc8"]]},{"id":"6614c08f.1d7b38","type":"ui_gauge","z":"3c31dc44.0e66fc","name":"","group":"173ca4ac.32a41b","order":0,"width":0,"height":0,"gtype":"gage","title":"gauge","label":"kPa","format":"{{value}}","min":"98","max":"102","colors":["#00b500","#e6e600","#ca3838"],"seg1":"","seg2":"","x":510,"y":400,"wires":[]},{"id":"173ca4ac.32a41b","type":"ui_group","z":"","name":"デフォルト","tab":"da05ff1c.ed28b","disp":true,"width":"6","collapse":false},{"id":"da05ff1c.ed28b","type":"ui_tab","z":"","name":"ホーム","icon":"dashboard"}] |
chart
簡易的にグラフ化するために、dashboardのchartノードを使用します。
以下のようにフローを配置します。
5秒間隔で表示を更新します。
chartノードの設定を開きます。
Y-axisなどを指定します。
Groupは任意で設定してください。
ダッシュボードタブの赤枠をクリックします。
Node-REDデプロイ後、injectノードをクリックするとグラフが5秒間隔で更新されます。
サンプルフロー
|
1 |
[{"id":"544fda30.517d24","type":"inject","z":"3c31dc44.0e66fc","name":"","topic":"","payload":"","payloadType":"date","repeat":"","crontab":"","once":false,"onceDelay":0.1,"x":180,"y":400,"wires":[["9435f249.fcabc8"]]},{"id":"9435f249.fcabc8","type":"Tibbit-#35","z":"3c31dc44.0e66fc","name":"","tpSlot":"S01","communication":"I2C","connectedStatus":"start","host":"","x":340,"y":440,"wires":[["79f67f42.c4eaf8","8446bb09.9f312"]]},{"id":"79f67f42.c4eaf8","type":"delay","z":"3c31dc44.0e66fc","name":"","pauseType":"delay","timeout":"5","timeoutUnits":"seconds","rate":"1","nbRateUnits":"1","rateUnits":"second","randomFirst":"1","randomLast":"5","randomUnits":"seconds","drop":false,"x":340,"y":500,"wires":[["9435f249.fcabc8"]]},{"id":"8446bb09.9f312","type":"ui_chart","z":"3c31dc44.0e66fc","name":"","group":"173ca4ac.32a41b","order":0,"width":0,"height":0,"label":"chart","chartType":"line","legend":"false","xformat":"HH:mm:ss","interpolate":"linear","nodata":"","dot":false,"ymin":"98","ymax":"102","removeOlder":1,"removeOlderPoints":"","removeOlderUnit":"3600","cutout":0,"useOneColor":false,"colors":["#1f77b4","#aec7e8","#ff7f0e","#2ca02c","#98df8a","#d62728","#ff9896","#9467bd","#c5b0d5"],"useOldStyle":false,"x":530,"y":420,"wires":[[],[]]},{"id":"173ca4ac.32a41b","type":"ui_group","z":"","name":"デフォルト","tab":"da05ff1c.ed28b","disp":true,"width":"6","collapse":false},{"id":"da05ff1c.ed28b","type":"ui_tab","z":"","name":"ホーム","icon":"dashboard"}] |


